Friendly QoE is designed to monitor and enhance user satisfaction across connected devices by collecting and analyzing essential data. Utilizing real-time device quality and connection health data, our Quality of Experience (QoE) module provides insights that reflect the user experience and highlights areas for improvement.
Key Features of QoE Monitoring
- Bulk Data Collection for In-Depth Analysis
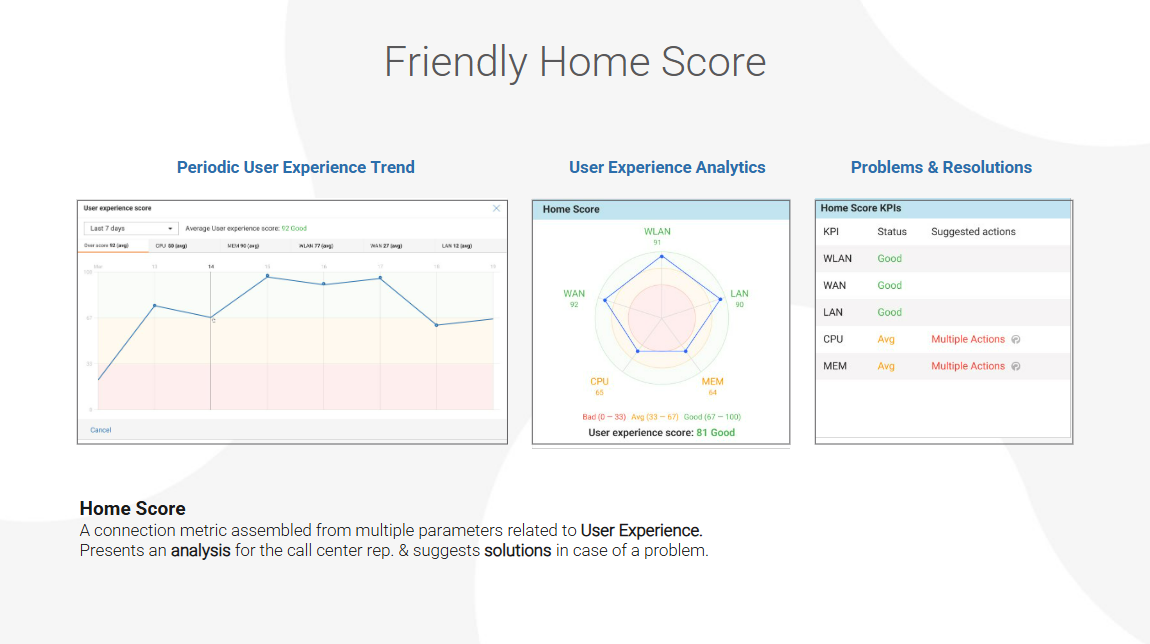
Collects extensive data from managed devices, offering insights into connection health, device performance, and interaction quality with minimal network impact. - Home Score
Generates a unique Home Score that quantifies the user experience, based on connectivity metrics and device responsiveness. This score provides users and support teams with an easy-to-understand metric for evaluating connection health and identifying issues. - Advanced Device and Connection Diagnostics
Proactive diagnostics by analyzing device performance metrics to identify and address connectivity drops or reduced responsiveness. Speed and latency testing is available to support regulatory compliance and deliver detailed performance insights. - Historical Data & Trend Reports
Stores and analyzes historical performance data, enabling the identification of recurring issues and tracking of service quality improvements over time.
Benefits for Service Providers
Improved Customer Satisfaction & Reduced Churn
Friendly QoE’s data-driven insights and proactive diagnostics enable faster issue resolution, leading to increased user satisfaction and reduced churn.
Enhanced Support Efficiency
By leveraging Friendly QoE’s real-time data and trend analysis, support teams can diagnose issues rapidly, significantly reducing both call volume and resolution time.
Actionable Business Intelligence
Data insights can guide strategic decisions, such as prioritizing device upgrades or network optimizations, based on observed quality metrics and performance trends.
QoE in Action

Friendly QoE seamlessly integrates with TR-069 and TR-369 devices to monitor device health, connectivity status, and user experience metrics in real time. Here’s how each component works:
Data Collection
Friendly QoE continuously gathers a wealth of data from connected devices, including:
- Connectivity Metrics
- Device Health Indicators
- Historical Performance Trends.
This data is securely stored and accessible for analysis, providing a foundation for in-depth insights into overall network and device performance.
User Experience Scoring with Home Score
The platform generates a unique Home Score based on the aggregated metrics of LAN, WLAN, WAN, and device health, such as:
- Connection Stability
- Device Responsiveness
- Overall Network Quality
This score offers a straightforward and quantifiable measure of user experience, providing a clear benchmark for assessing overall connectivity health.
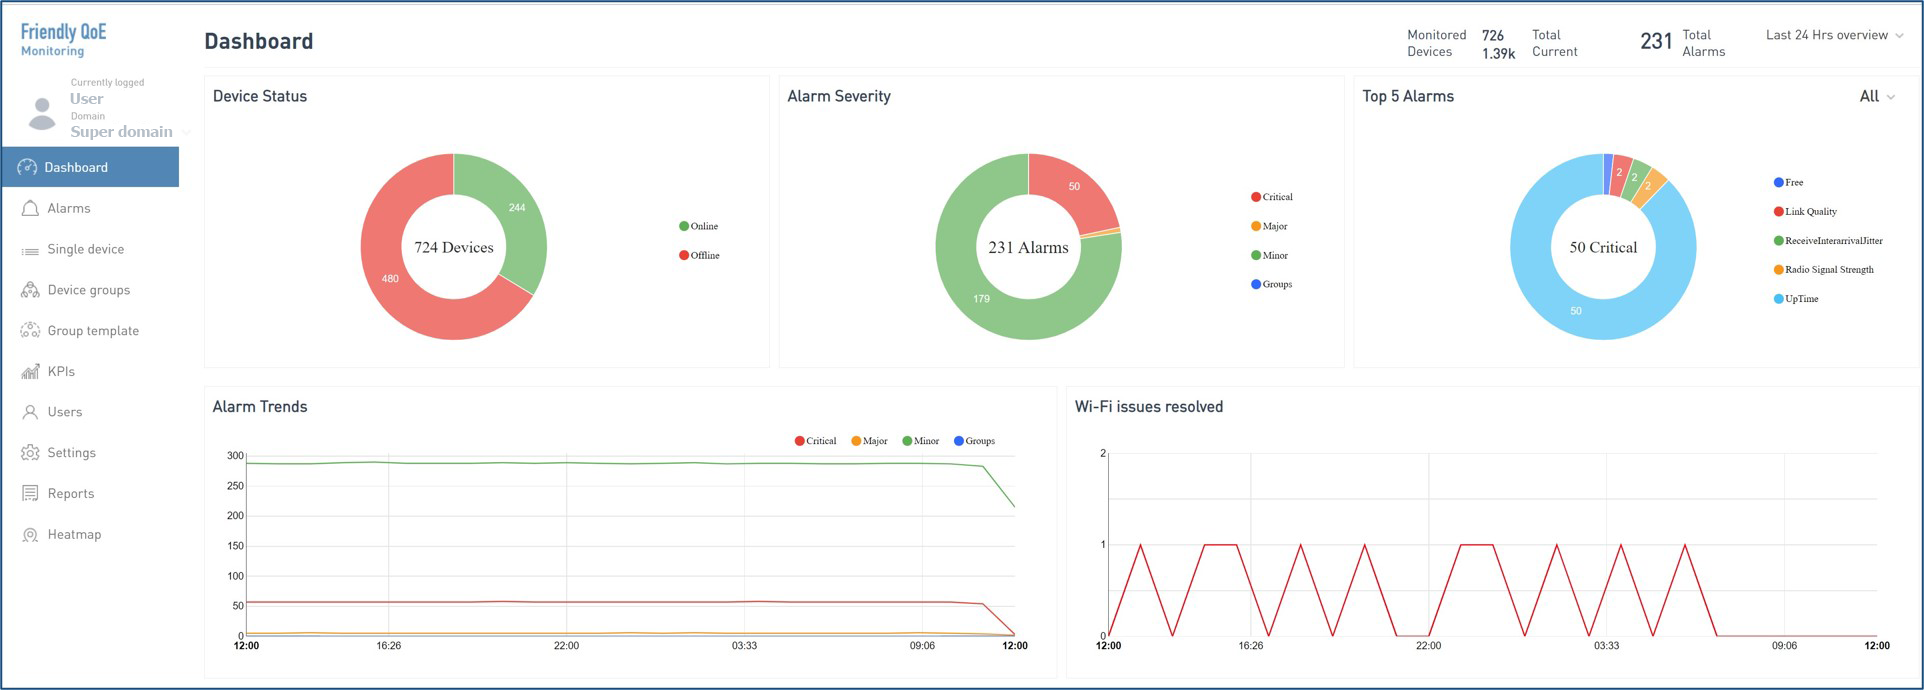
Proactive Alerts
Friendly QoE’s alert system identifies and flags potential issues before they affect users, such as connectivity drops or device malfunctions. Proactive alerts allow support teams to take swift, targeted action, ensuring an optimized and uninterrupted user experience.

The collected data can also be visualized with our Power BI integration for enhanced reporting and detailed trend analysis, providing stakeholders with actionable insights for continuous service improvement.

Friendly IoT Device Management
One-IoT™ Device Management
IoT Application Enablement
Friendly Smart Home
Embedded Clients
Friendly LwM2M client
Friendly OMA-DM Client
Friendly Partners
Commercial Partners
Device Manufacturers
Resources
Blog & News
Glossary
Webinars
About Friendly Technologies